
How to use Excel for Training Management


For Training Tuesday, we are continuing our discussion from previous weeks. How do we capture information from large groups of people? What is the most effective way to show this information in a way that we can make sense of and identify trends?
For the sake of this discussion, the metric we will be capturing is the standard qualification score. We have our company’s information input along with all the scores captured. Now that we have all that, what can we do to identify trends across the formation? To do that, we need to create what is called a pivot chart.
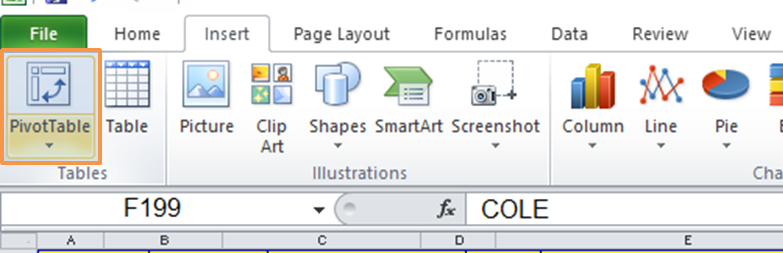
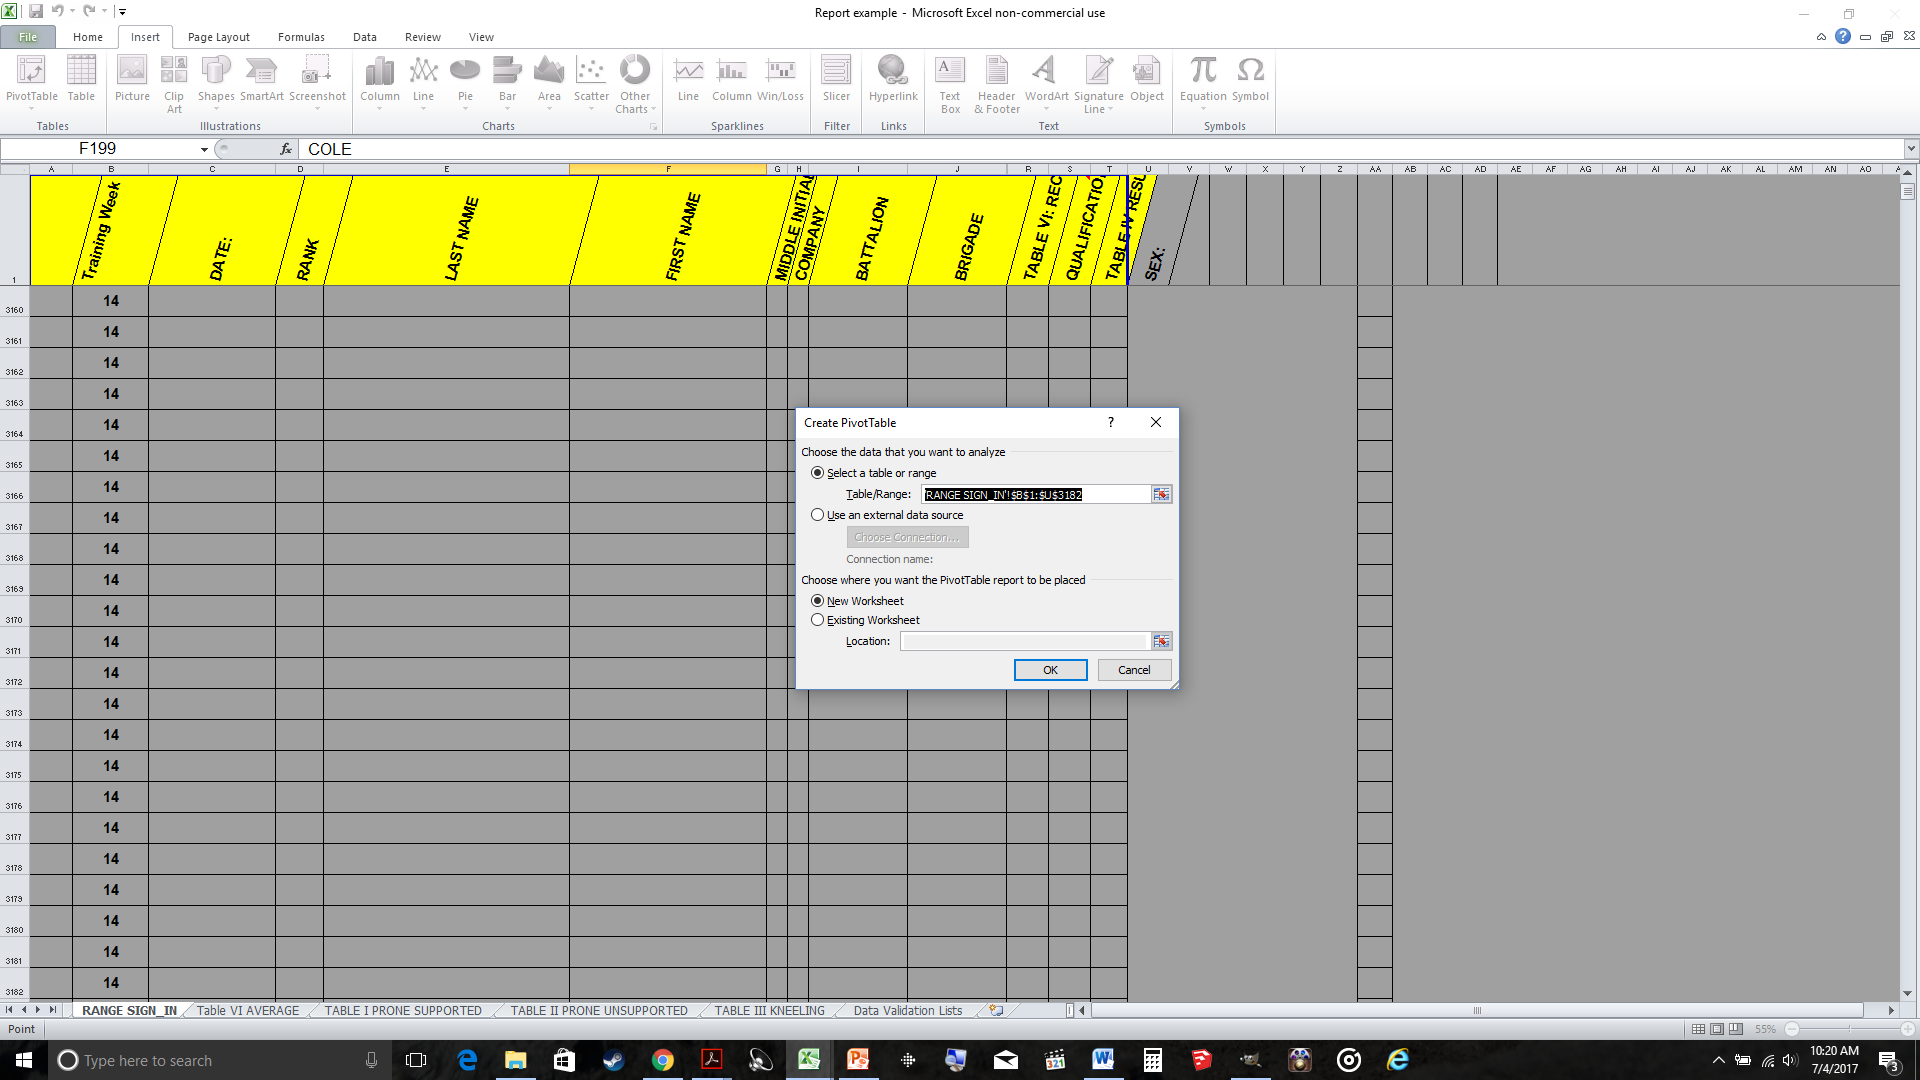
To start, we select the ‘insert’ tab at the top of the Excel table and select the ‘PivotTable’ button. Once we do that, a dialogue box will pop up, asking you to choose what data you want to analyze. If you are going to be maintaining this information for a long period of time, I would suggest selecting at least down to 3000 rows. Do NOT select the whole columns, as it will make the file really big, and it will slow down the overall processing of the spreadsheet.
Under newer versions of Excel, it will offer you the option to add data to the data model. I recommend you select this option before hitting ‘OK.’
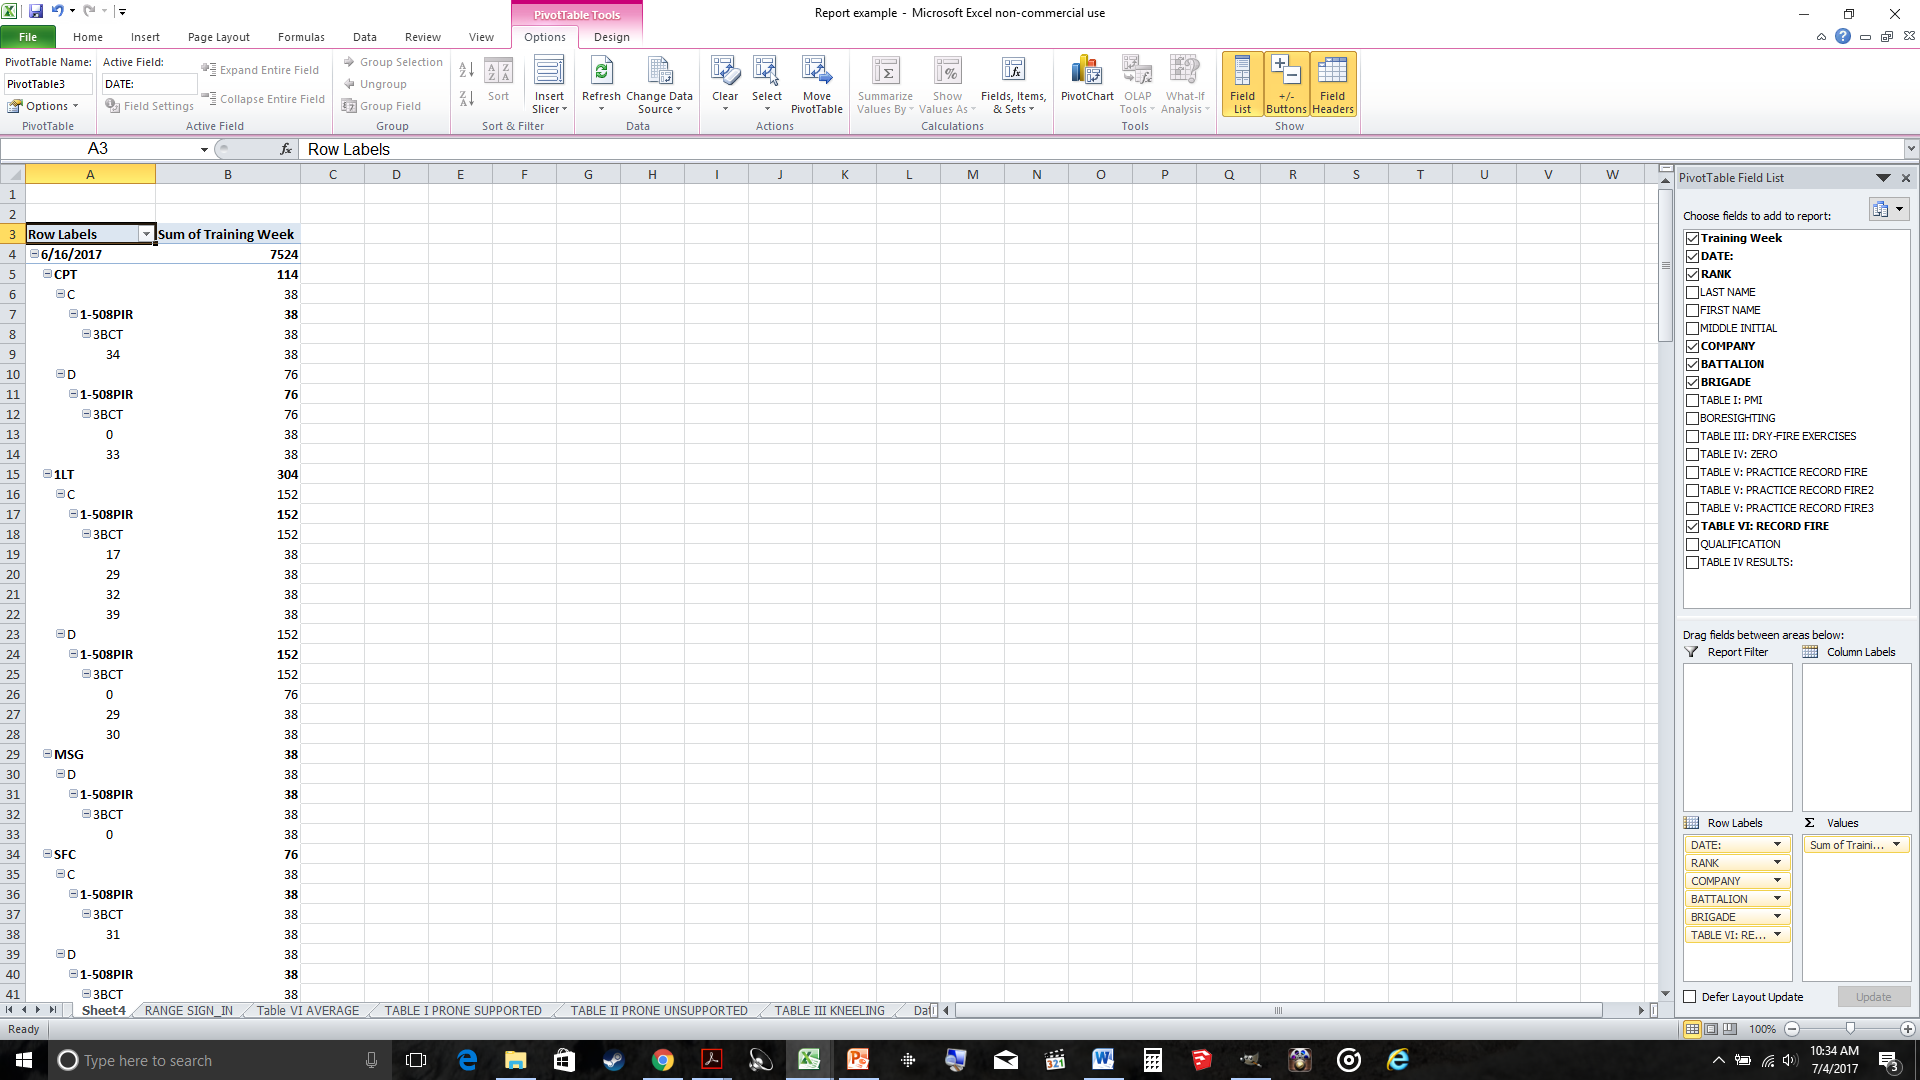
Now it is going to create a new tab, with a menu on the right allowing you to select what data you wish to be a part of the PivotTable. In this case, we will select ‘Training Week’, ‘Date’, ‘Rank’, ‘Company’, ‘Battalion’, ‘Brigade’, and ‘Table VI: Record Fire.’ Picture three shows that this all gets stacked in the row Label, which doesn’t make much sense for our PivotTable. So we have to click and drag these labels to make more sense of them.
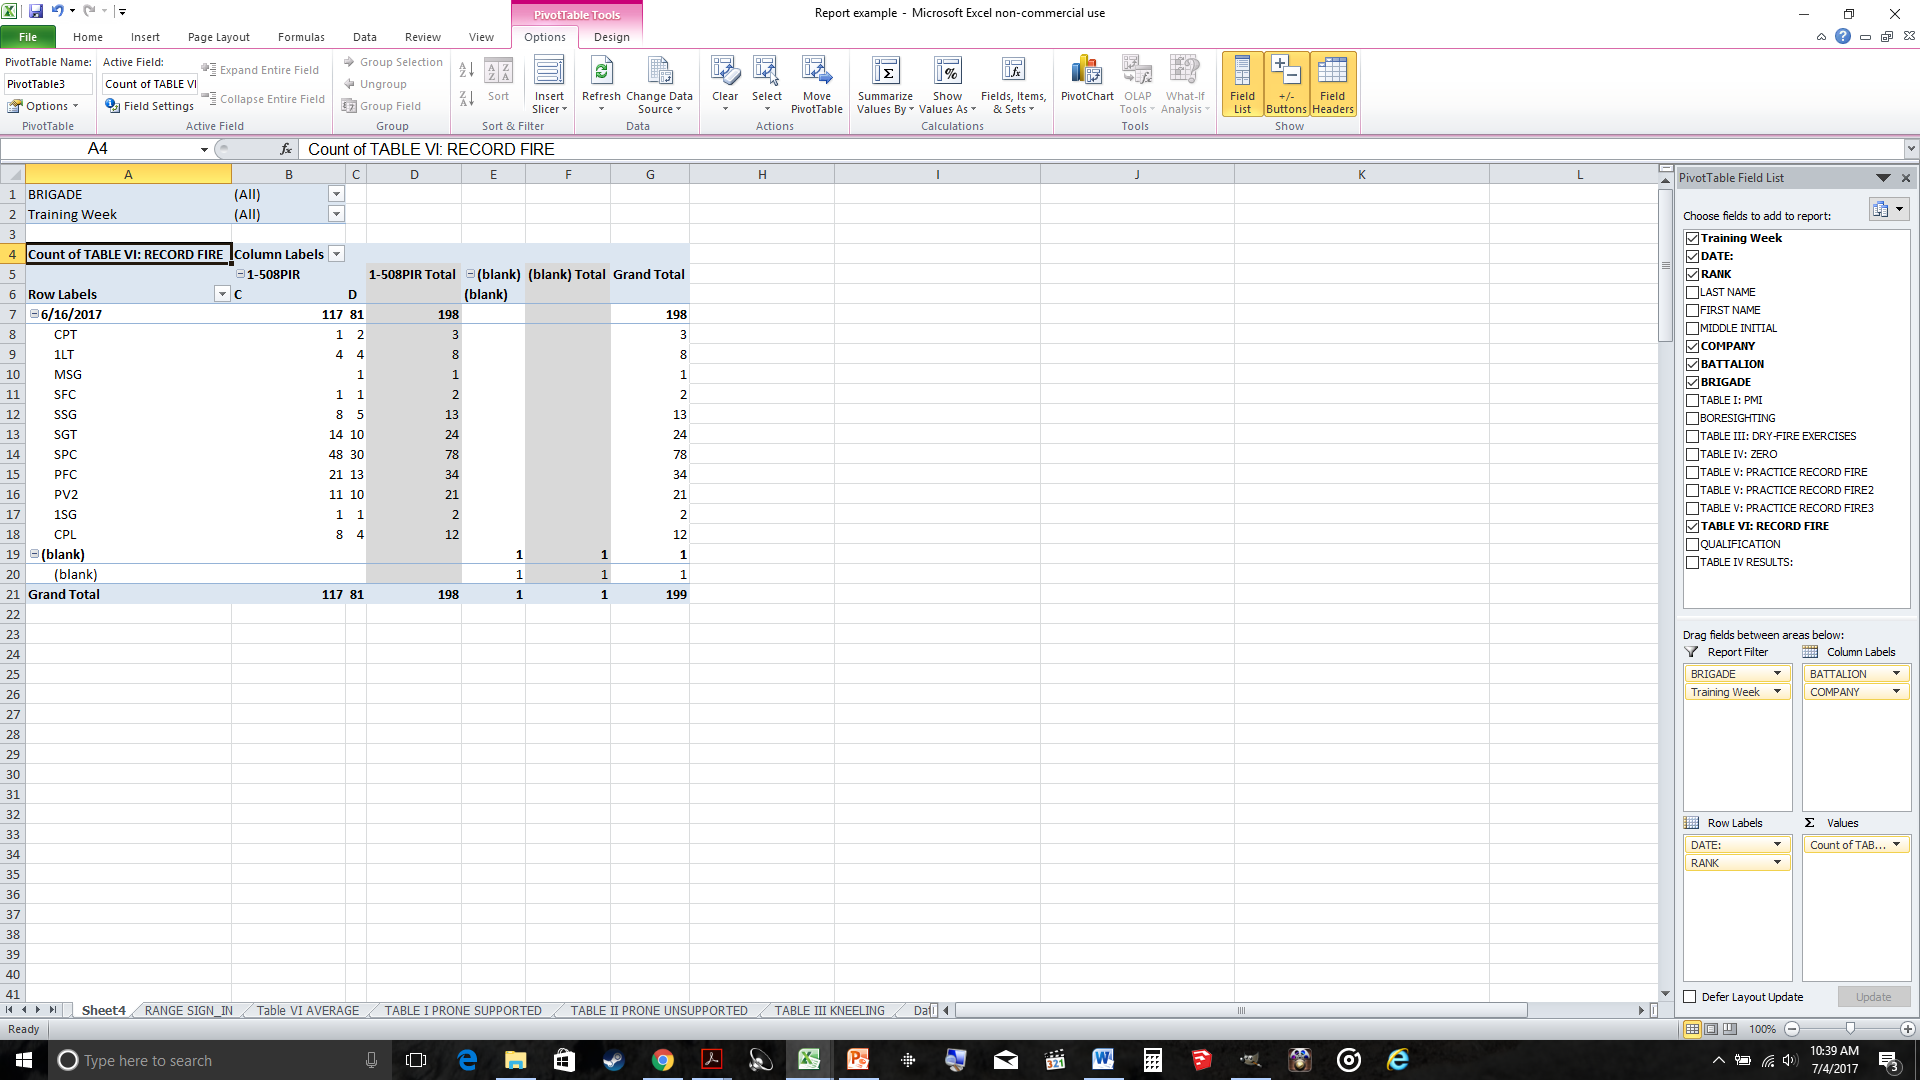
Picture five shows something that makes more sense. We’ve placed the battalion and Company nested in the column labels, with brigade and training week as report filters. The Values of the report are set as a count of ‘Table VI: Record Fire.’ And the Rows are the Date and Rank of the individuals.
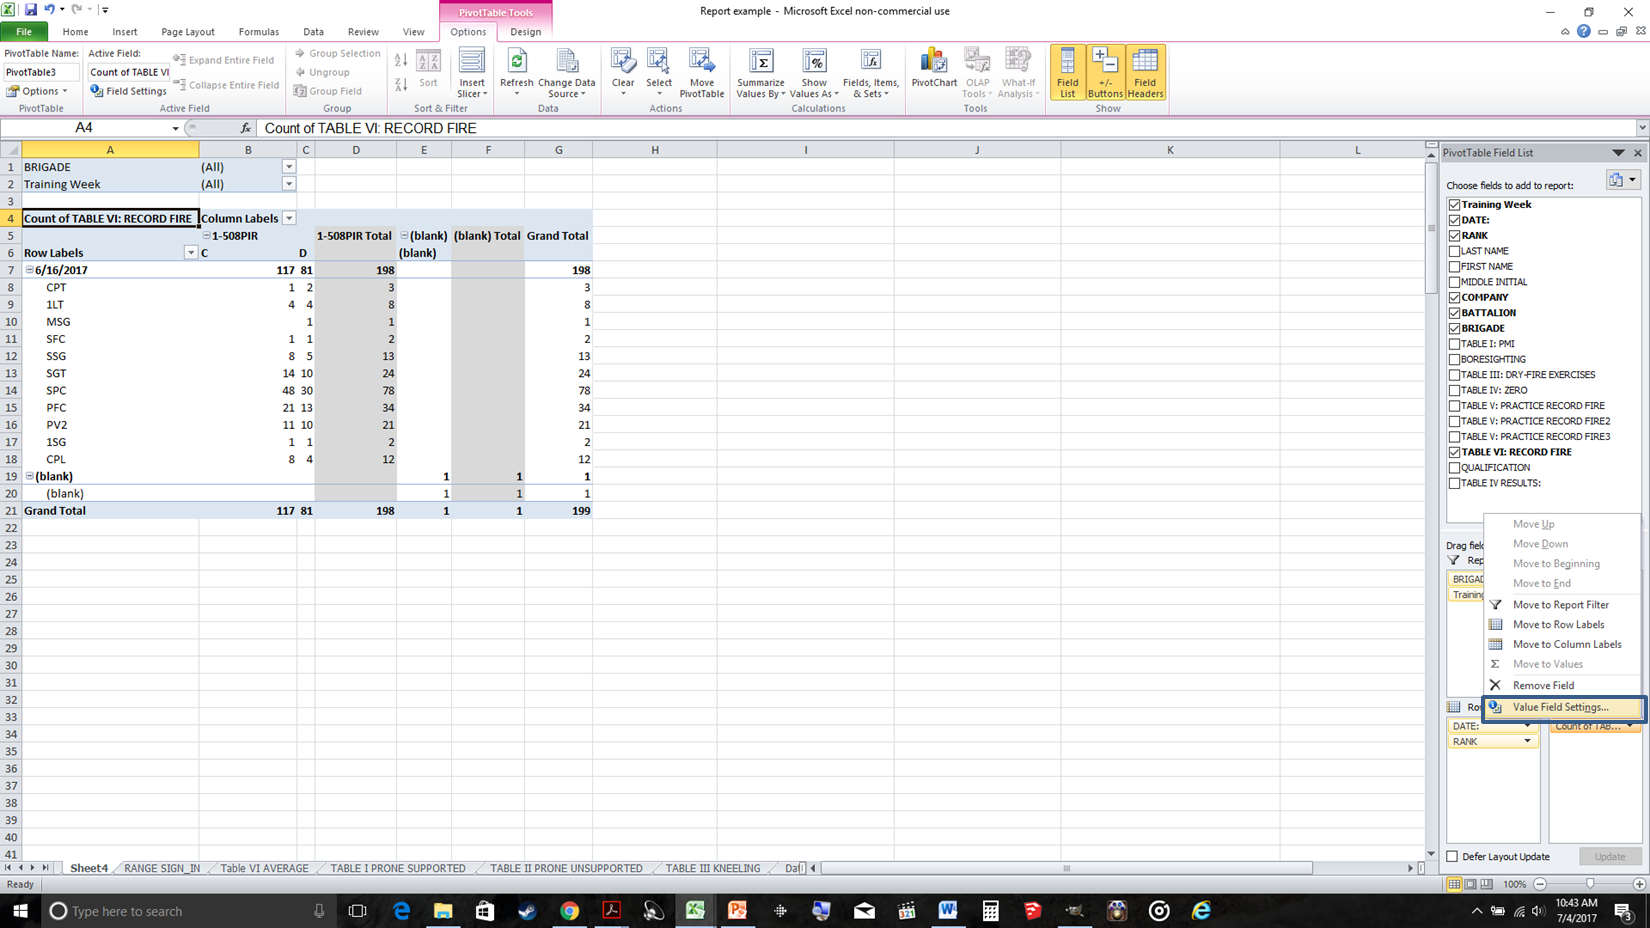
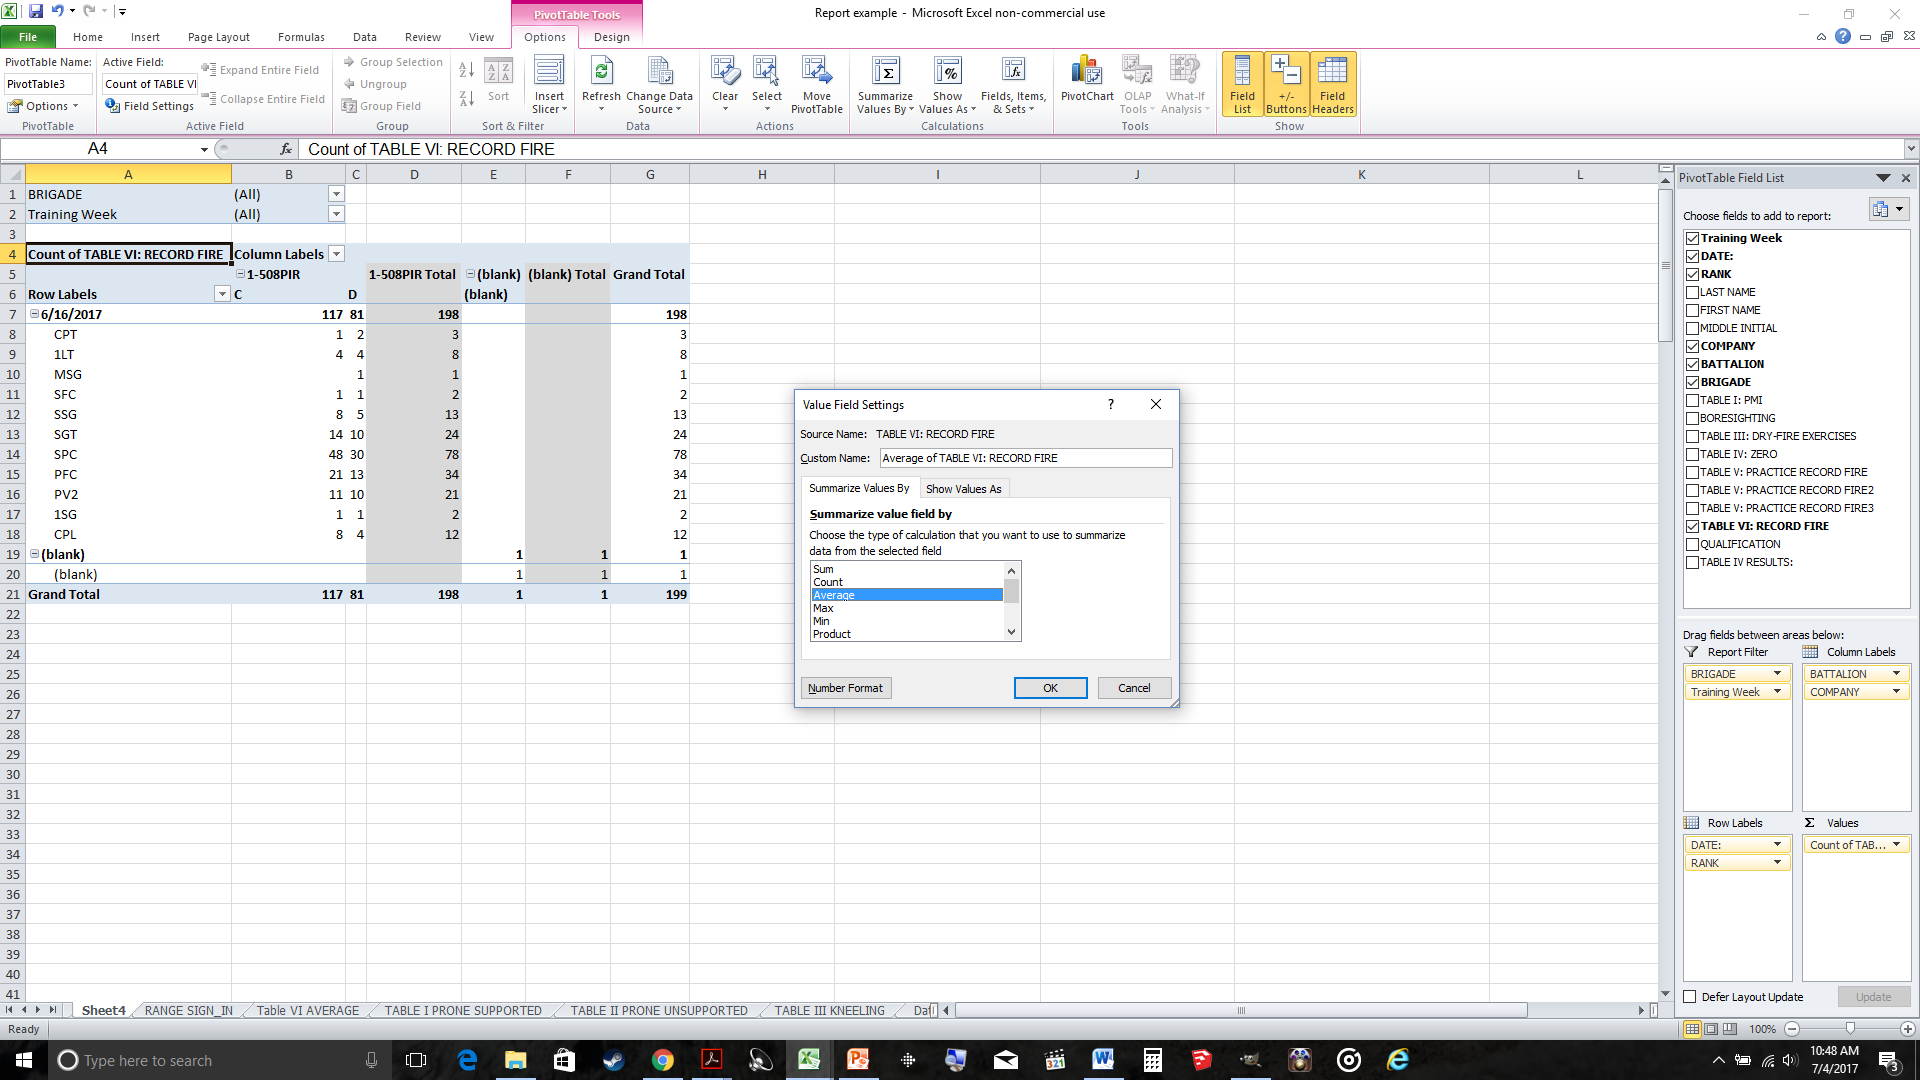
You will notice, however, that the count is giving us the total number of personnel of that rank who fired. This is good for record checking, but not really giving us what we need for the overall qualification averages. To find that out, we left click on the value ‘count of Table VI: Record Fire’ and select average under the ‘summarize values by’ dialog. Pictures seven and eight illustrate this:
This will give us our averages by rank finally, but we have some cleaning up to do. Selecting the table and right clicking will allow us to select the ‘format cells’ option. From there, we click on the ‘number’ tab, which will allow us to change the cells to the ‘number’ format. This allows us to set the number of numbers past the decimal point. Picture nine illustrates this.

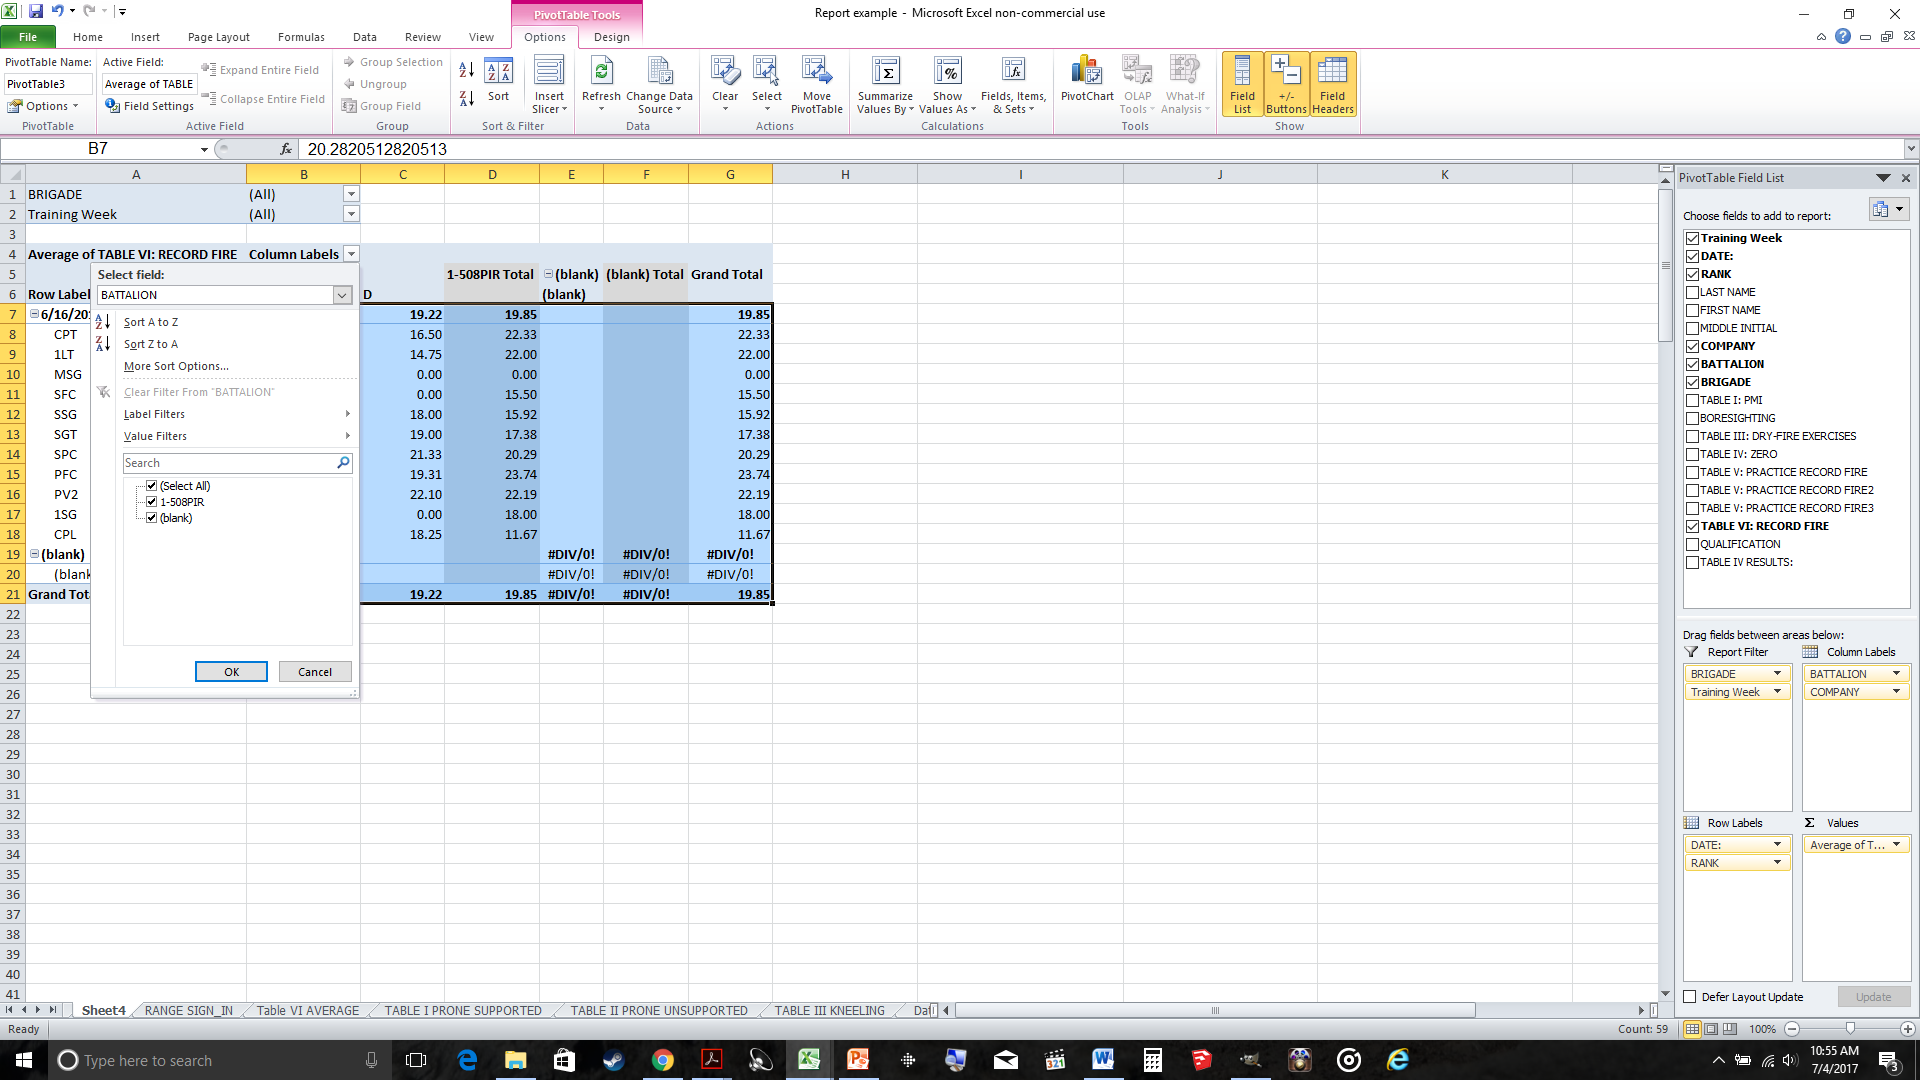
Now we can select what we don’t need on the report, things such as the blank information columns can go. To do this, we select the drop downs next to the row and column labels and de-select any information we do not want present in the report. Picture 11 illustrates this for us.
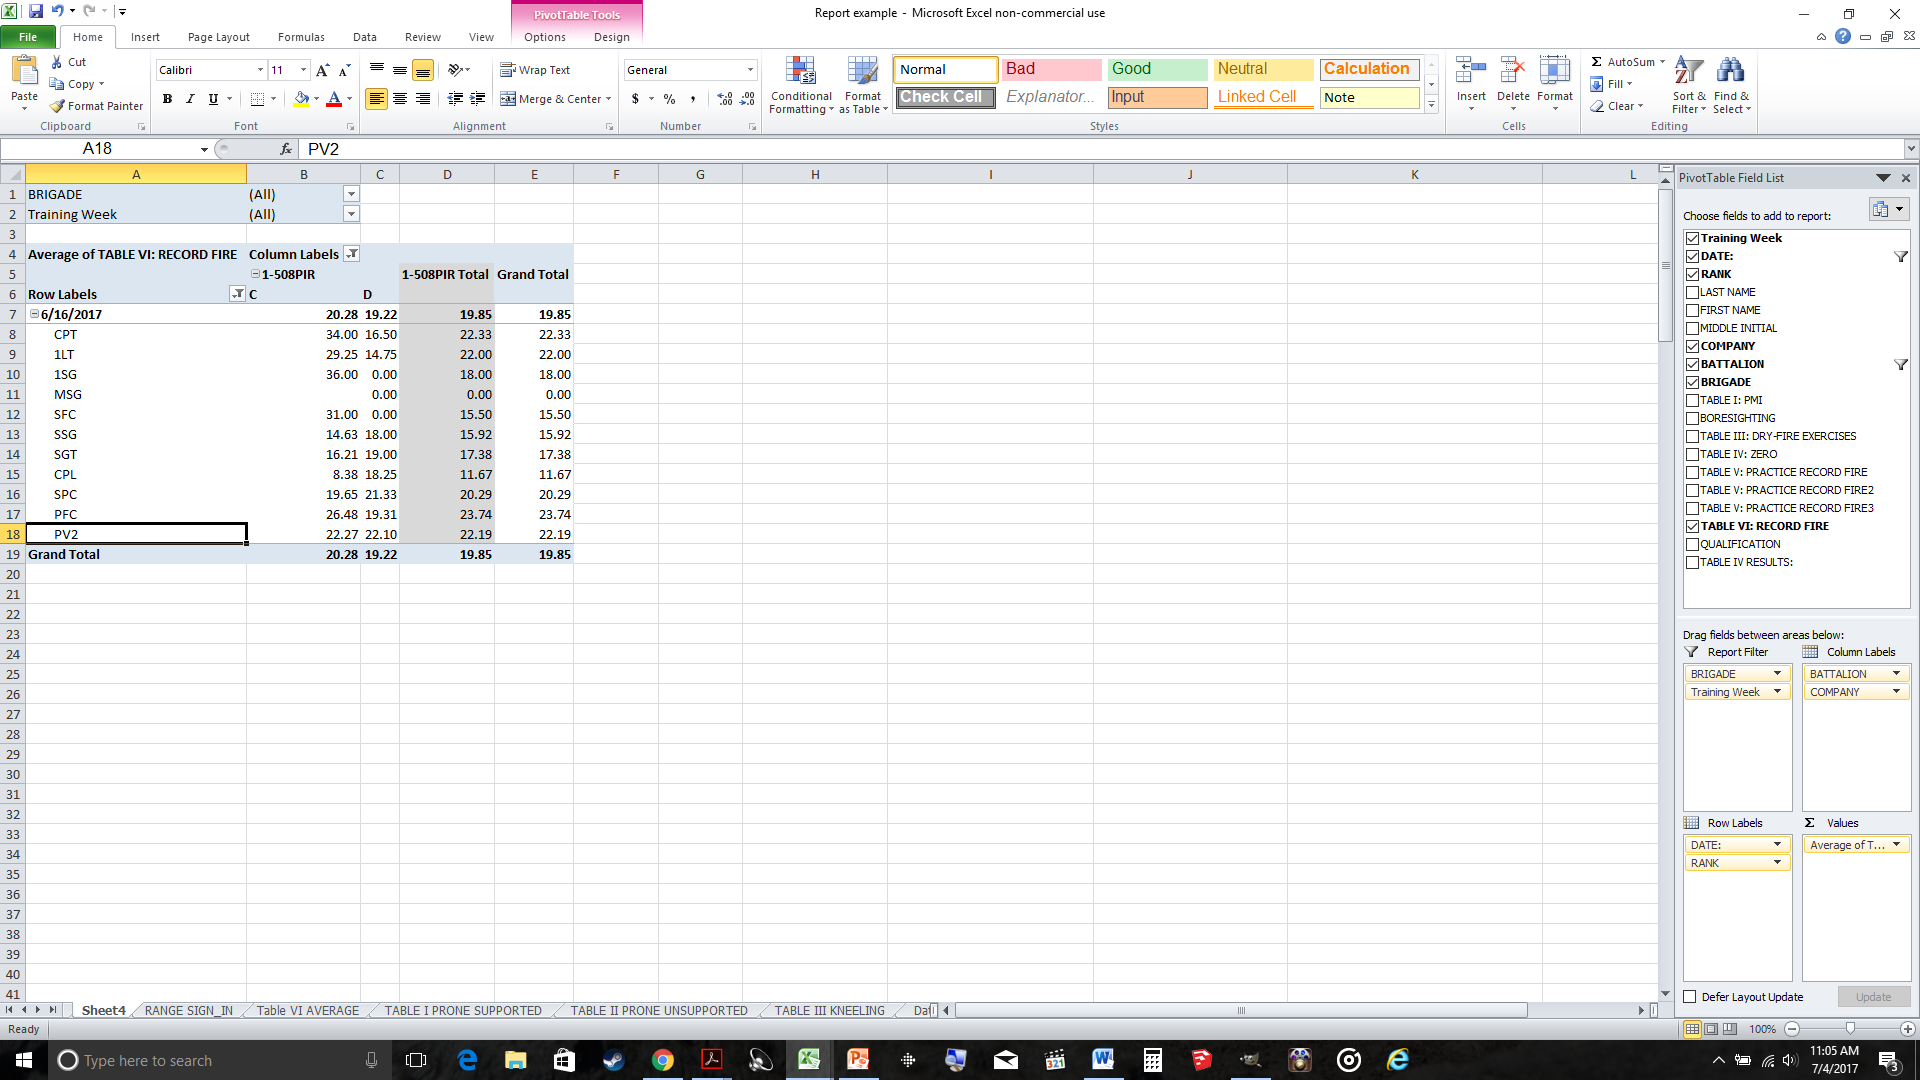
The final thing we need to do is make sure that the report is in the order we want. The Pivot table will allow you to drag the rows and columns and it will automatically adjust the data. For example, we want to put our rows in order by rank. First Sergeant, which is down by the bottom of the sheet, needs to move up to the top. We select the cell, getting the solid black border around like shown in picture 12, and when the four-way arrow icon is showing over it, we move the cell to where we want it and release.
Now the report is in a format that makes sense and shows us the information we could get as efficiently in any other way.
So to sum up, PivotTables allow us to take the existing information we have gathered, and manipulate it in a way that presents facts that would take a long time to gather any other way. You have to be willing to experiment with the format of the report to get the results you want.
#weaponsmastery #excelisyourfriend
Comments
So empty here ... leave a comment!